Model fitting and inference for infectious disease dynamics

Bayesian inference with mathematical models

Introduction

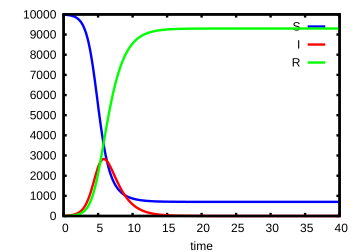
SIR-type models

dSdt=−βISNdIdt=βISN−γIdRdt=γI \begin{aligned} \frac{dS}{dt} &= -\beta I \frac{S}{N}\\ \frac{dI}{dt} &= \beta I \frac{S}{N} - \gamma I\\ \frac{dR}{dt} &= \gamma I \end{aligned}

Mechanistic models: description vs mechanism.

Model fitting: parameter estimation

Given a model, what are the parameter combinations that best fit the data?

Why are we doing this?

  • Learn something about the system
    • test a scientific hypothesis — e.g. why did the UK H1N1 epidemic wane in summer 2009?
    • estimate parameters — e.g. what fraction of cholera infections in Bangladesh are asymptomatic?
    • sometimes in real time
  • Validate the model, especially for prediction

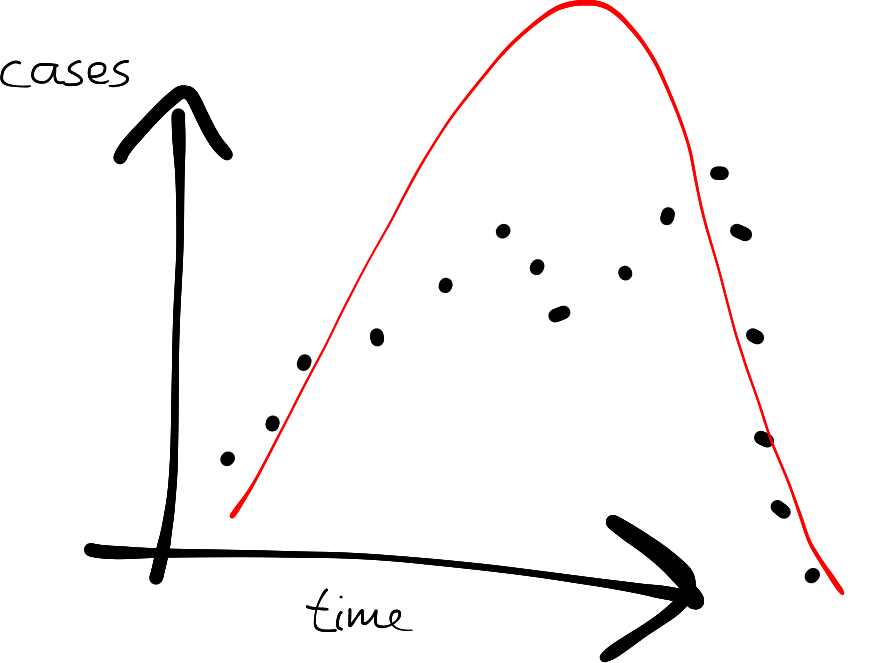
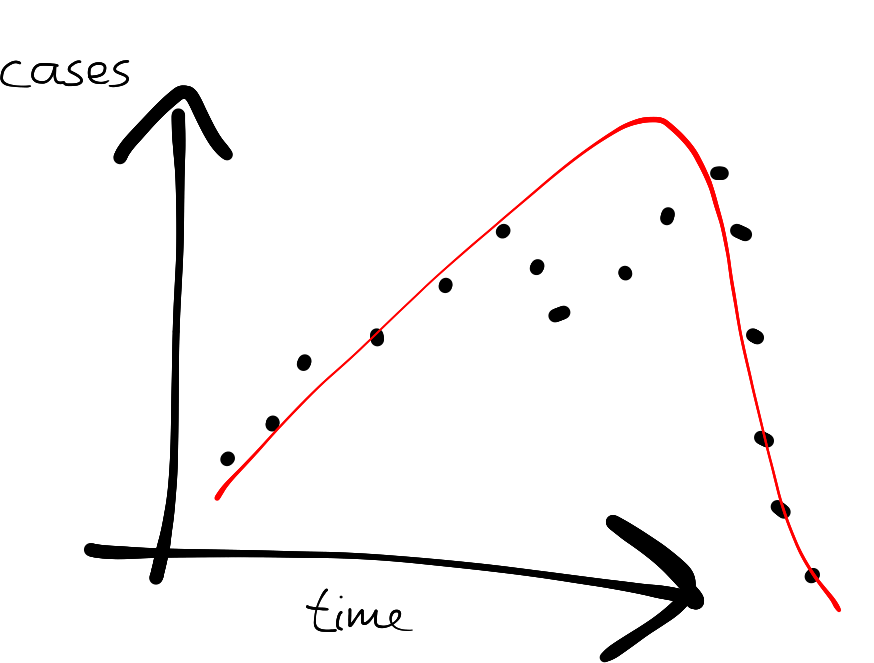
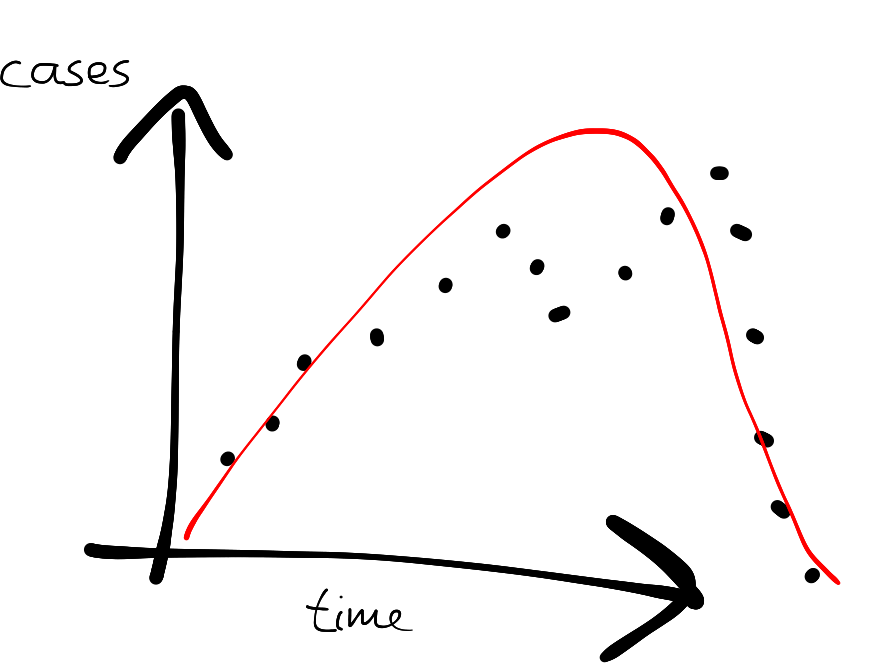
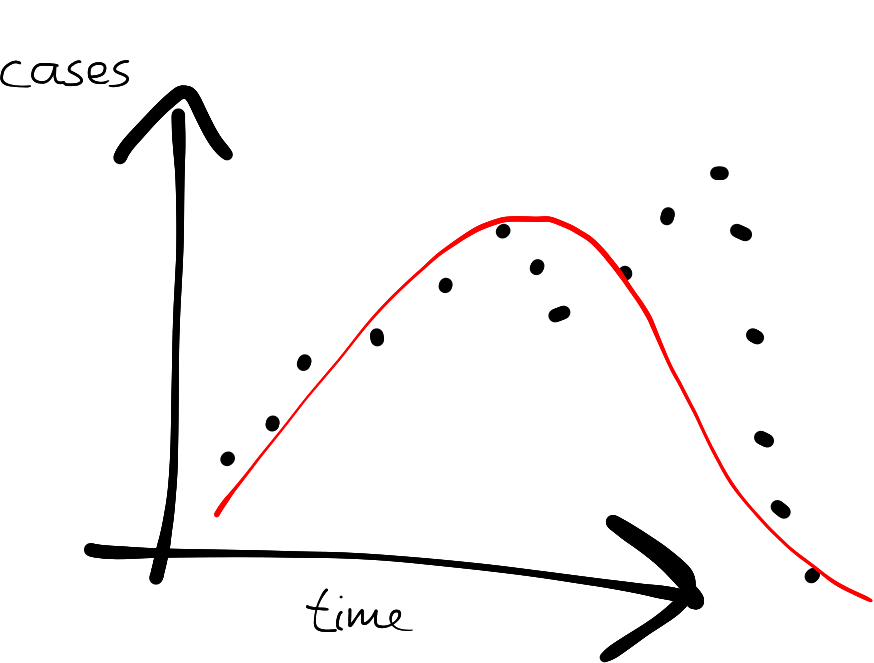
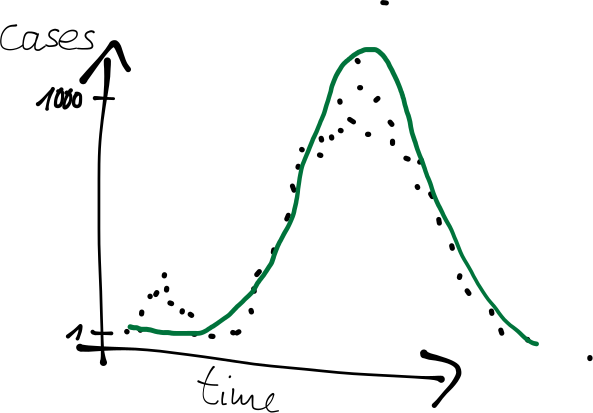
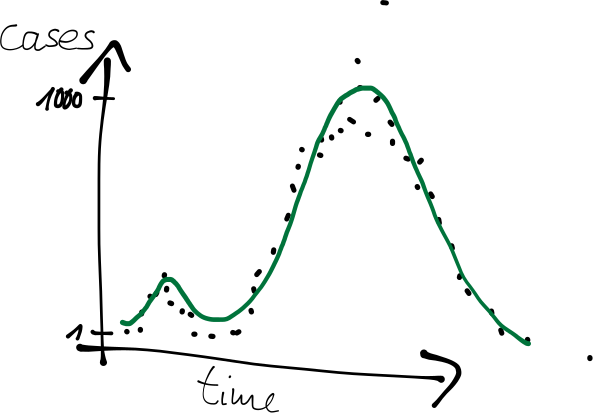
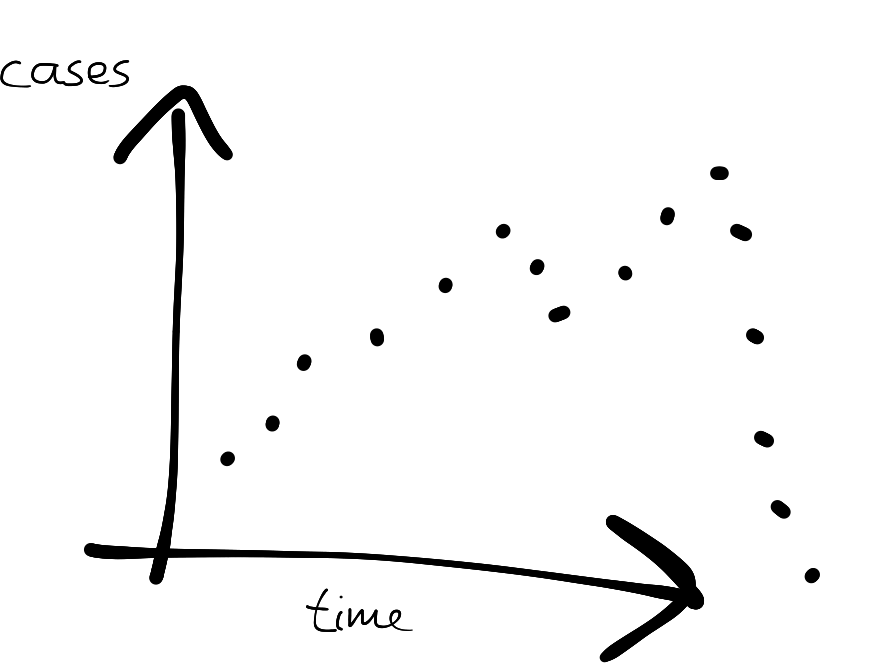
What do we mean by “best fit the data”?
Model inference: state estimation

Given what we observe, what is the state of the system?
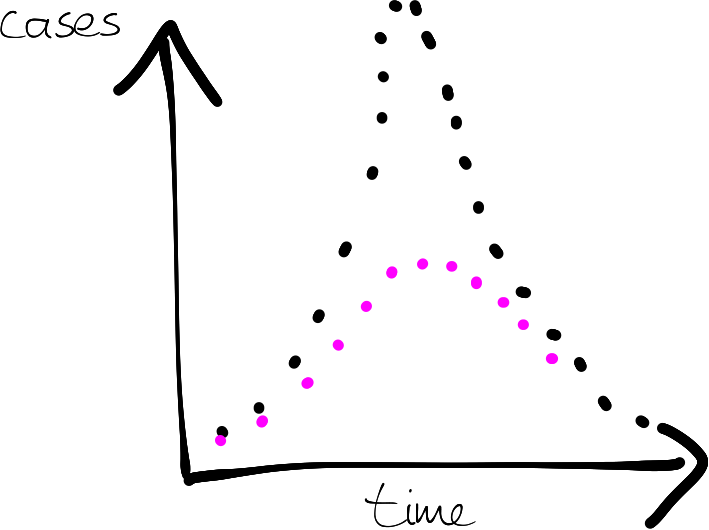
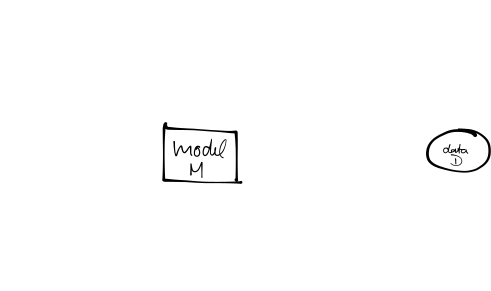
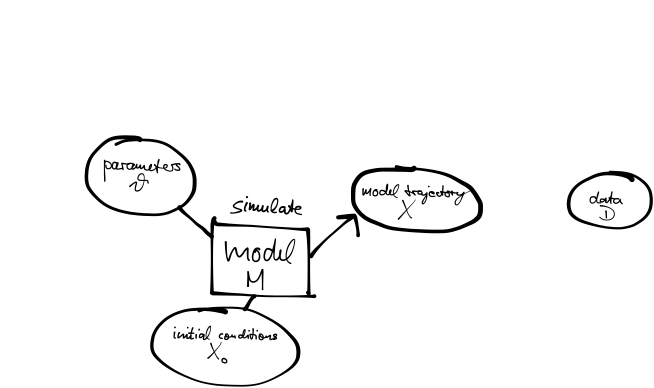
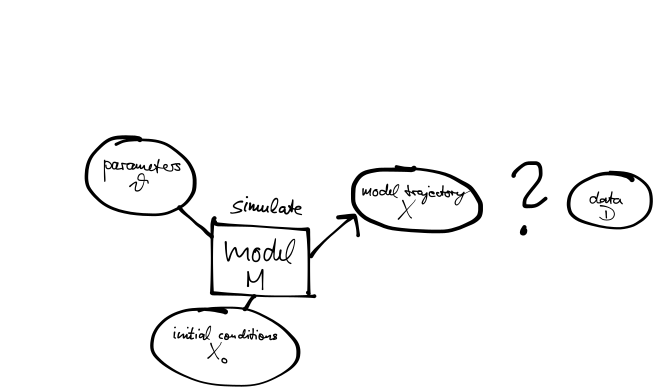
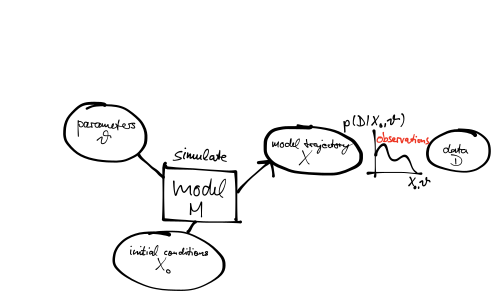
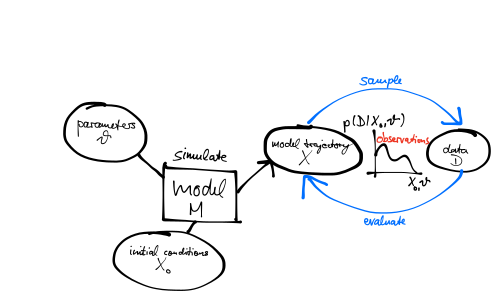
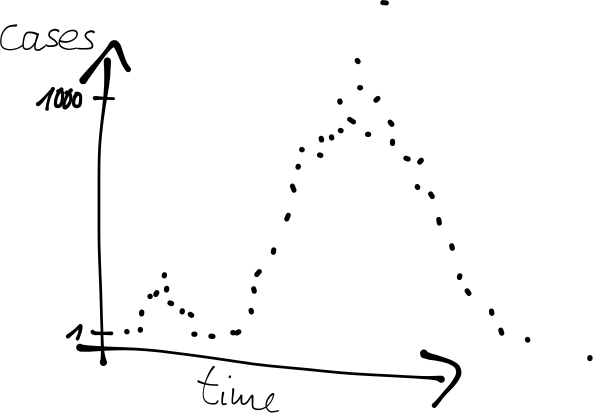
Linking models to data

Assessing the “closeness” of model output and data
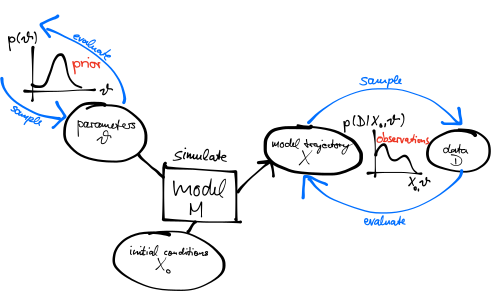
Probabilistic formulation

  • Often we know something about how the data were taken, so observations introduce uncertainty.

  • We can express the uncertainty in observing the process as a probability

    p(data∣underlying process)p(\text{data} \mid \text{underlying process})

  • Including this in our model gives

    p(data∣model output)p(\text{data} \mid \text{model output})

Probability distributions: discrete

How many soldiers die of horse kicks, at 0.61 deaths per corps per year? Counts of rare, independent events follow a Poisson distribution.

Bortkiewicz (1898) counted 122 deaths across 10 Prussian corps in 20 years.

Evaluate the probability of a value

pdf(Poisson(0.61), 2)
0.10109042919131067

Sample a value at random

rand(Poisson(0.61))
1

Probability distributions: continuous

What will the temperature be in London tomorrow? A continuous quantity, here a normal distribution.

Evaluate the density at a value

pdf(Normal(23, 2), 30)
0.0004363413475228801

Sample a value at random

rand(Normal(23, 2))
22.148058841536916

Example: observation uncertainty

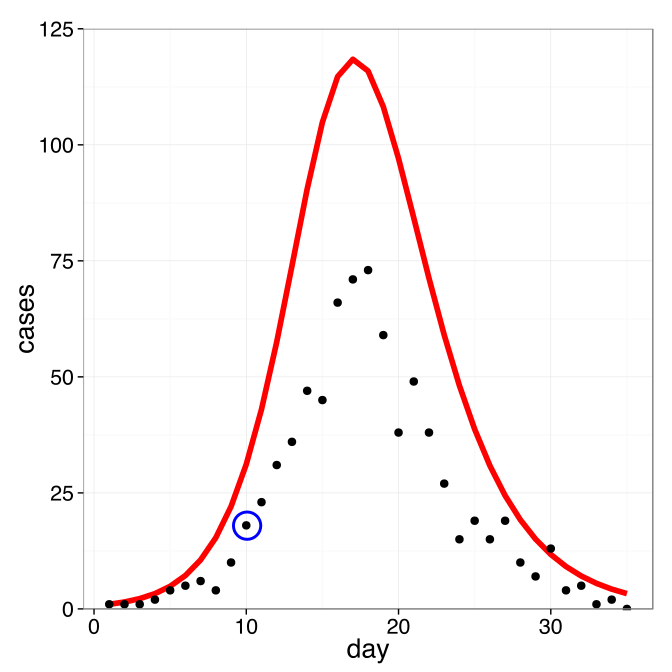
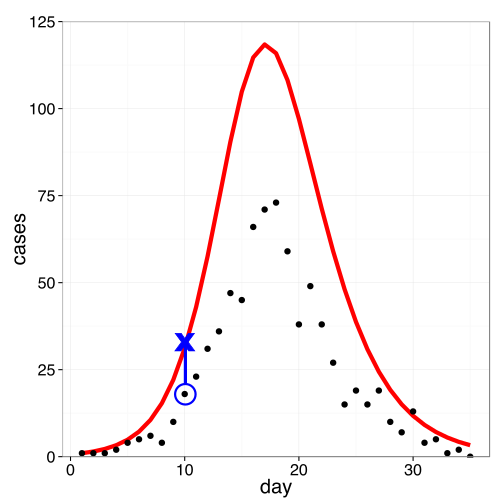
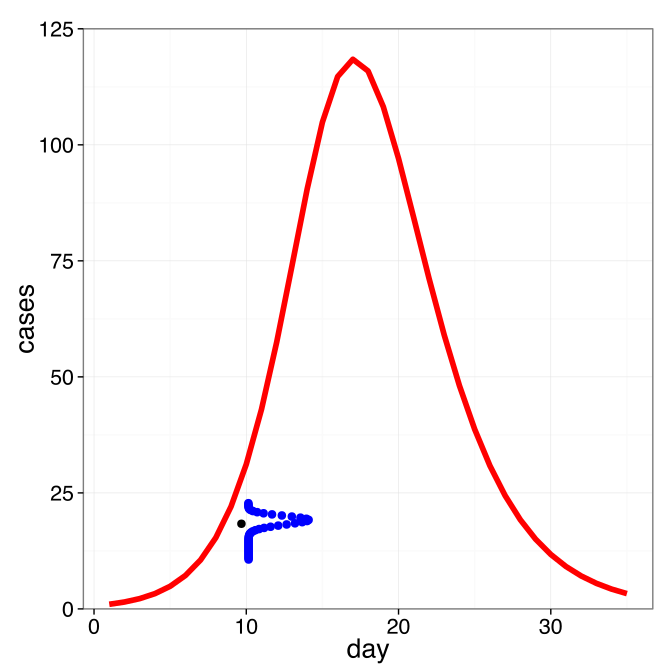
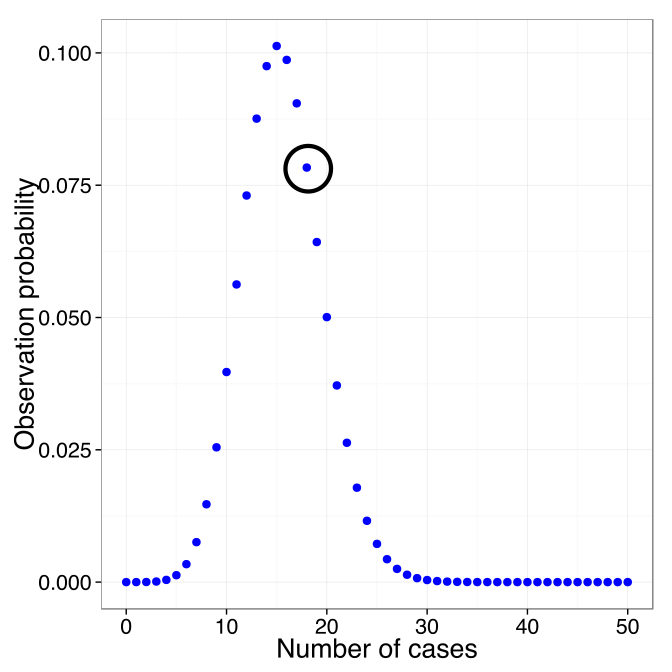
SIR model, assuming cases are detected with reporting probability ρ=0.5\rho = 0.5, and that observations are conditionally independent given the trajectory: knowing the model, one day’s error tells us nothing about the next.
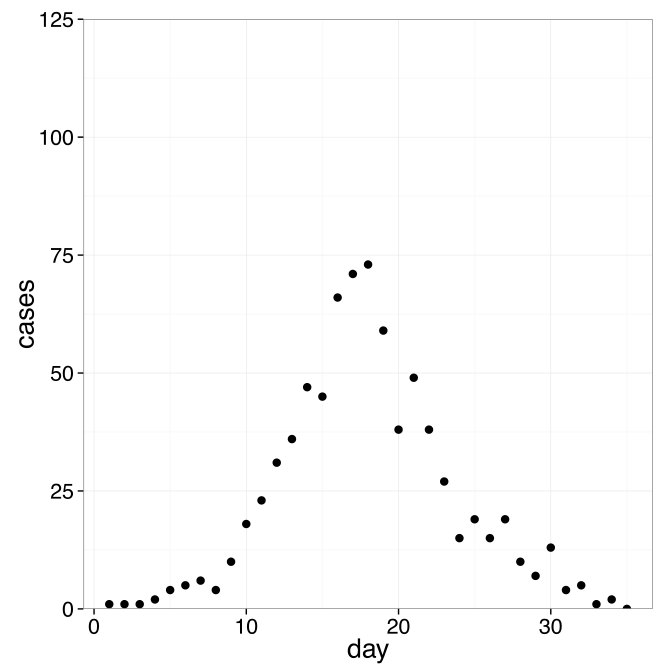
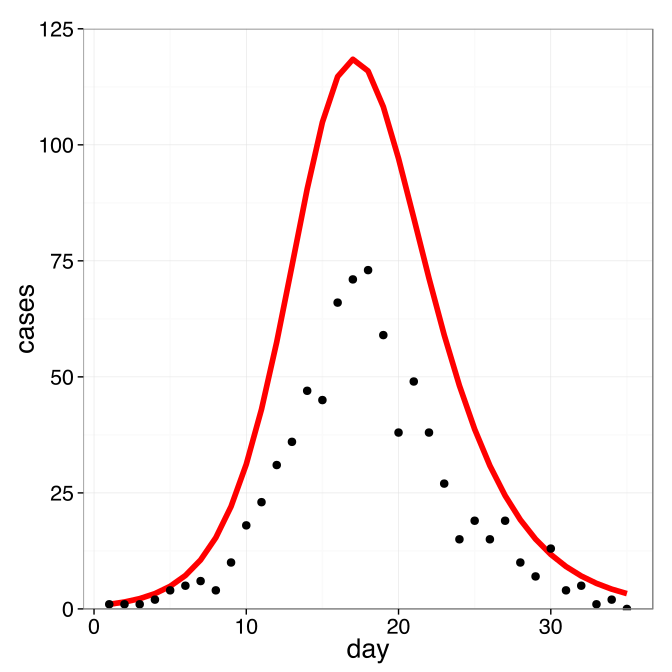
At time 10, 18 cases observed.

In the model, 31.1 cases.
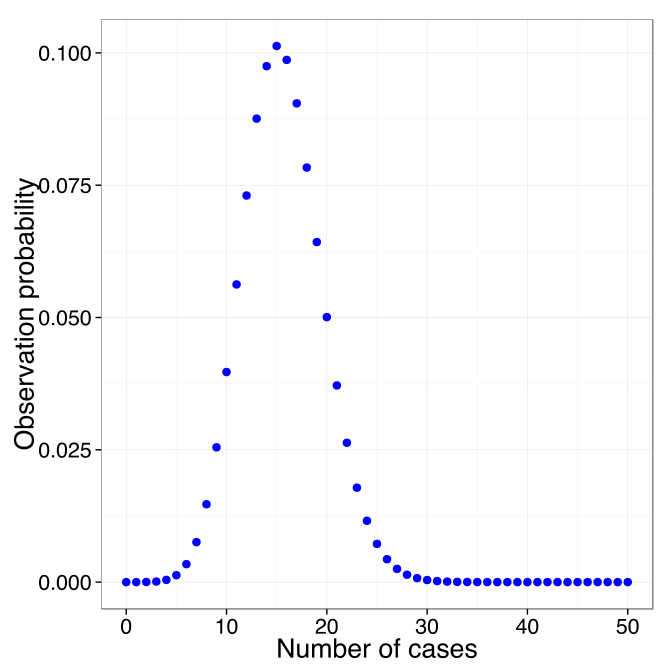
p(data point 10∣θ)=0.078p(\text{data point } 10 \mid \theta) = 0.078

From one point to the whole trajectory

Multiply across the data to get the probability of the whole trajectory:

p(data∣θ)=∏ip(data point i∣θ)p(\text{data} \mid \theta) = \prod_{i} p(\text{data point } i \mid \theta)

Or sum on the log scale, which is numerically better behaved:

log⁡p(data∣θ)=∑ilog⁡p(data point i∣θ)\log p(\text{data} \mid \theta) = \sum_{i} \log p(\text{data point } i \mid \theta)

The likelihood

  • We compare models to data using probabilities:

    p(data∣model output)p(\text{data} \mid \text{model output})

  • For a given model this depends on the parameters θ\theta:

    L(θ)=p(data∣θ)L(\theta) = p(\text{data} \mid \theta)

    is called the likelihood of parameters θ\theta. Here θ\theta encompasses all parameters, e.g. θ={β,γ}\theta = \{\beta, \gamma\}.

  • Likelihoods can span a wide range of orders of magnitude, which causes numerical problems. Taking the logarithm gives the log-likelihood.

Bayesian inference

Bayes’ rule

In Bayesian inference we need p(θ∣data)p(\theta \mid \text{data}). Applying the rule of conditional probabilities:

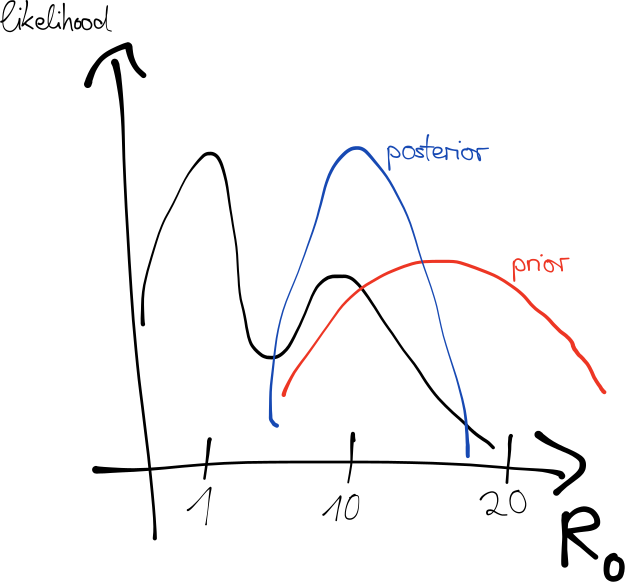
p(θ∣data)=p(data∣θ)p(θ)p(data)p(\theta \mid \text{data}) = \frac{p(\text{data} \mid \theta)\, p(\theta)}{p(\text{data})}

  • p(θ∣data)p(\theta \mid \text{data}) is the posterior
  • p(data∣θ)p(\text{data} \mid \theta) is the likelihood
  • p(θ)p(\theta) is the prior
  • p(data)p(\text{data}) is a normalisation constant

In words,

(posterior)∝(normalised likelihood)×(prior)\text{(posterior)} \propto \text{(normalised likelihood)} \times \text{(prior)}

Prior probabilities

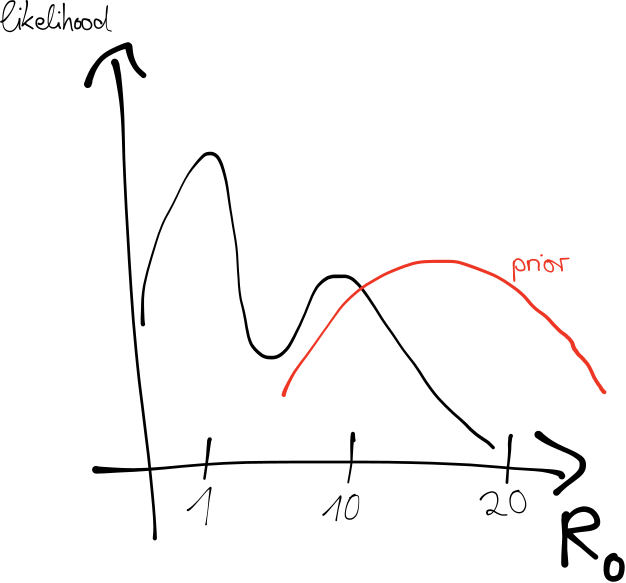
p(θ)p(\theta) is our belief about the parameters before we see the data, taken from previous measurements, the literature, or experts.
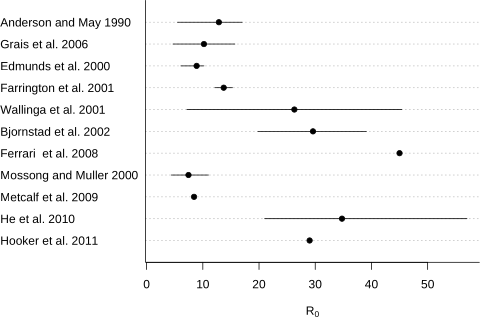
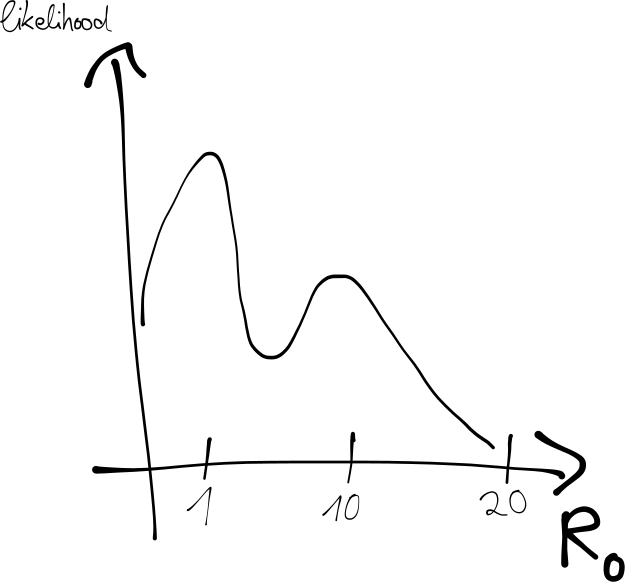
A prior for the R0R_0 of measles

Example: estimating R0R_0 of measles

Checking a prior by simulating from it

A prior on R0R_0 is hard to have intuition about. An epidemic curve is not.

So draw parameters from the prior, run the model, and look at what you get. This is a prior predictive simulation, and it turns an abstract claim into a picture you can judge.

If your prior produces epidemics that infect the whole population in four days, you have learned something you could not have seen from the parameter range.

Sampling from the posterior

Parameters θ\theta are interpreted as a random variable, distributed according to the posterior:

p(θ∣data)∝p(data∣θ)p(θ)p(\theta \mid \text{data}) \propto p(\text{data} \mid \theta)\, p(\theta)

We want to generate samples of θ\theta from this distribution.

We cannot just try all parameter combinations

You can explore a two-parameter posterior on a grid. Fifteen values each is 225 model runs, which is nothing.

Parameters Grid points at 15 each
2 225
4 50,625
6 11,390,625
10 576,650,390,625

So a grid is a good way to look at a posterior in two dimensions, and no way at all to fit a model with six parameters. The next session is about what to do instead.

Practical session

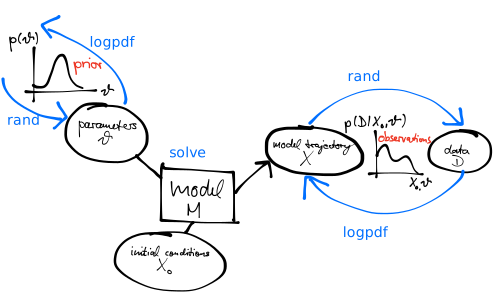
The arrows as Julia functions

Your Turn

  • Simulate an SIR model and explore what the priors imply
  • Evaluate a Poisson likelihood against observed data
  • Combine them into a posterior, and explore it by grid search

mfiidd.github.io/mfiidd

Return to the session