using Random ## for random numbers
using Distributions ## for probability distributions
using DifferentialEquations ## for differential equations
## the stochastic simulation below is sampled by JumpProcesses.jl, via Gillespie's direct method
using DataFrames ## for data frames
using Plots ## for plots
using StatsPlots ## for statistical plots
using Turing ## for probabilistic programming and MCMC
using CSV ## for CSV file reading
using DrWatson ## for datadir()
using MFIIDD ## the course package, which holds the SEITL implementationsStructure and stochasticity
Modelling interlude
Estimated time: 90 minutes
Introduction
Entering the stochastic tier: You’ve completed the core sessions with deterministic ODE models, and diagnosed an SIR model that could not reproduce the Tristan da Cunha outbreak. This session builds a model that can, and introduces stochastic simulation. Fitting resumes in the particle filters session.
We have a model, we ran posterior predictive checks on it, and it went wrong. So we change something. This session is about the two changes that we’ll make to our SIR model.
We add a mechanism. The SIR model cannot infect anybody twice, and the outbreak infected 92 islanders twice. No value of , or repairs that, because it is the structure that forbids it. The SEITL model adds a temporary immune stage that drains back into susceptible, so a second wave can run through people the first wave already had. The name follows its compartments: susceptible, exposed, infectious, temporarily immune and long-term immune. SEIT4L is the same model with the temporary immunity stage split into four, which is where its 4 comes from.
We add stochasticity. The ODE model treats 284 people as a smooth quantity, and they are not. Even if the distribution of the infectious period is the same for all islanders, some will stay infectious longer than others by chance and produce more secondary cases. This is demographic stochasticity, and in a population this small it drives the dynamics rather than jittering them. Whether the epidemic takes off at all, and how large the second wave is, are partly matters of luck.
The two changes are independent, and this session makes each of them in turn. Stochastic simulation costs much more to run and, as the next sessions show, far more to fit, so it is worth understanding when you need it.
This session focuses on modelling rather than fitting, which returns in the Particle filters and Particle MCMC sessions. It also takes the opportunity to make the model biologically more realistic, by using distributions for the time spent in each compartment that beat the exponential.
Objectives
In this session you will:
- Familiarise yourselves with the structure of the SEITL model and try to guess its parameter values from the literature.
- Compare deterministic and stochastic simulations in order to explore the role of demographic stochasticity in the dynamics of the SEITL model.
- Use a more realistic distribution for the time spent in one of the compartment and assess its effect on the shape of the epidemic.
ImportantStochastic models produce different results each run
Unlike deterministic models, stochastic simulations give different outputs every time you run them - even with identical parameters. This is a feature, not a bug: it reflects the real randomness in small populations.
What this means for you: - Your plots will look different from your neighbour’s (and from any solutions we show) - Running the same code twice gives different trajectories - This is expected and correct behaviour
We set Random.seed!(1234) for reproducibility within a session, but the key insight is that stochastic variability between simulations is precisely what makes inference harder and more interesting.
NoteCourse roadmap
This session marks a transition in the course. We move from general inference methods (MCMC, diagnostics, model checking) to the modelling the last session’s failed checks call for, and to the stochastic simulation a population of 284 requires.
The remaining sessions build on the SEITL/SEIT4L models introduced here:
- Particle filters: Estimating likelihoods for stochastic models
- Particle MCMC: Full Bayesian inference using particle filters
- Observation Models: Comparing likelihood-based and likelihood-free inference
- Variational Inference: Fast approximate inference for real-time applications
- Universal Differential Equations (optional): Learning unknown mechanisms with neural networks
Setup
Source file
The source file of this session is located at sessions/seitl.qmd.
Load libraries
Initialisation
We set a random seed for reproducibility.
Random.seed!(1234)TaskLocalRNG()Load data
flu_tdc = CSV.read(datadir("flu_tdc_1971.csv"), DataFrame)59×3 DataFrame
34 rows omitted
| Row | date | time | obs |
|---|---|---|---|
| Date | Int64 | Int64 | |
| 1 | 1971-08-13 | 1 | 0 |
| 2 | 1971-08-14 | 2 | 1 |
| 3 | 1971-08-15 | 3 | 0 |
| 4 | 1971-08-16 | 4 | 10 |
| 5 | 1971-08-17 | 5 | 6 |
| 6 | 1971-08-18 | 6 | 32 |
| 7 | 1971-08-19 | 7 | 47 |
| 8 | 1971-08-20 | 8 | 37 |
| 9 | 1971-08-21 | 9 | 29 |
| 10 | 1971-08-22 | 10 | 11 |
| 11 | 1971-08-23 | 11 | 13 |
| 12 | 1971-08-24 | 12 | 8 |
| 13 | 1971-08-25 | 13 | 2 |
| ⋮ | ⋮ | ⋮ | ⋮ |
| 48 | 1971-09-29 | 48 | 0 |
| 49 | 1971-09-30 | 49 | 0 |
| 50 | 1971-10-01 | 50 | 0 |
| 51 | 1971-10-02 | 51 | 2 |
| 52 | 1971-10-03 | 52 | 0 |
| 53 | 1971-10-04 | 53 | 0 |
| 54 | 1971-10-05 | 54 | 0 |
| 55 | 1971-10-06 | 55 | 0 |
| 56 | 1971-10-07 | 56 | 0 |
| 57 | 1971-10-08 | 57 | 0 |
| 58 | 1971-10-09 | 58 | 0 |
| 59 | 1971-10-10 | 59 | 1 |
The outbreak, in brief
You met the Tristan da Cunha outbreak in the model checking session and fitted an SIR model to it: 284 islanders, 312 recorded attacks over 59 days, and a second peak on day 32 that a single wave of infection cannot produce. The checks said the structure was wrong. This session builds one that can produce a second wave, and simulates it stochastically because 284 people are few enough for chance to matter.
Three details from that account matter below. The ship that started it landed five islanders on 13 August: three had fallen ill during the eight-day voyage and two fell ill on landing. Only 312 of the 365 attacks (85%) were dated precisely enough to be in the dataset. And the virus was influenza A/H3N2, which had emerged only three years earlier, while the island’s last influenza outbreak had been A/H1N1 in 1954.
# Plot daily observed incidence
scatter(
    flu_tdc.time, flu_tdc.obs,
    xlabel = "Time (days)", ylabel = "Daily incidence",
    label = "Observed cases", markersize = 4, color = :red,
    title = "Tristan da Cunha 1971 Influenza Outbreak"
)
SEITL model
One possible explanation for the rapid influenza reinfections reported during this two-wave outbreak is that following recovery from a first infection, some islanders did not develop long-term protective immunity and remained fully susceptible to reinfection by the same influenza strain that was still circulating. This can be modelled as follows:
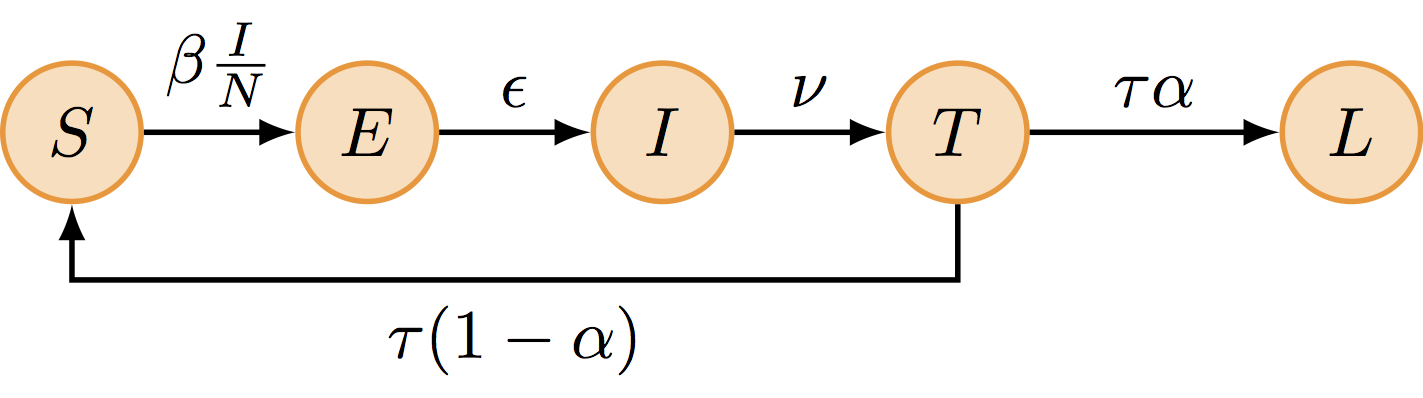
The SEITL model can be described with five states (S, E, I, T and L) and five parameters:
- basic reproductive number ()
- latent period ()
- infectious period ()
- temporary-immune period ()
- probability of developing a long-term protection ().
and the following deterministic equations:
where , , , and is constant.
It can be shown that there is an analogy between the deterministic equations and the algorithm that performs stochastic simulations of the model. In that sense, the deterministic equations are a description of the stochastic model, too.
In order to fit the SEITL model to the Tristan da Cunha dataset we need to add one state variable and one parameter to the model:
- The dataset represents daily incidence counts: we need to create a state variable - called - to track the daily number of new cases. Assuming that new cases are reported when they become symptomatic and infectious, we have the following equation for the new state variable:
- The dataset is incomplete: only 85% of the cases were reported. In addition, we need to account for potential under-reporting of asymptomatic cases. We assume that the data were reported according to a Poisson process with reporting rate . Since this reporting rate is unknown (we can only presume that it should be below 85% due to reporting errors) we will include it as an additional parameter.
Parameter values and initial state
Based on the outbreak as recalled above (the full account is in the model checking session) and the information below found in the literature, can you think of one or more set(s) of values for the parameters and initial state of the model?
- The of influenza is commonly estimated to be around 2. However, it can be significantly larger in close-knit communities with exceptional contact configurations.
- Both the average latent and infectious periods for influenza have been estimated around 2 days each.
- The down-regulation of the cellular response is completed on average 15 days after symptom onset.
- Serological surveys have shown that the seroconversion rate to influenza (probability of developing antibodies) is around 80%. However, it is likely that not all seroconverted individuals acquire a long-term protective against reinfection.
- Between 20 and 30% of the infections with influenza are asymptomatic.
- There is very limited cross-immunity between influenza viruses A/H1N1 and A/H3N2.
TipHint: Reasonable parameter ranges
Based on the literature above, here are reasonable starting guesses:
| Parameter | Reasoning | Suggested range |
|---|---|---|
| R_0 | Typically ~2 for influenza, but higher in close-knit communities | 4-10 |
| D_lat | Latent period ~2 days | 1-3 |
| D_inf | Infectious period ~2 days | 1-4 |
| D_imm | Cellular response ~15 days post-symptom | 10-20 |
| α | Seroconversion ~80%, but not all develop long-term immunity | 0.4-0.8 |
| ρ | <85% reporting, minus asymptomatic (20-30%) | 0.5-0.7 |
These are just starting points. The inference will refine them.
Deterministic vs stochastic simulations
NoteTwo choices in how the model runs
The two changes above each come with a choice about how the model is written and run:
- Simulation method: deterministic (ODEs) vs stochastic (Gillespie) — the stochasticity change, which controls whether we model individual-level randomness
- Compartment durations: exponential (SEITL) vs Erlang (SEIT4L) — a refinement of the mechanism, which controls how realistic the waiting times are
These are orthogonal: a deterministic SEIT4L and a stochastic SEITL are both valid models. This session simulates three of the four combinations, leaving a stochastic SEIT4L to Going further, and each choice addresses a different biological question.
Now, try to assess whether the SEITL model can reproduce the two-wave outbreak of Tristan da Cunha with your guess values for the initial state and the parameters. This will give you the opportunity to compare the deterministic and stochastic model. We suggest to start with the deterministic model and then move on to the stochastic model but feel free to proceed in a different way.
Deterministic simulations
Let’s look at the SEITL model for deterministic simulation.
These two functions live in src/seitl_model.jl and arrived with using MFIIDD above. They are shown from that source rather than repeated here, so the page and the code the later sessions run cannot drift apart.
Both unpack their arguments positionally, so it is worth having the orderings to hand: the state vector u is [S, E, I, T, L, Inc], where Inc accumulates cumulative incidence, and the parameter vector p is [R_0, D_lat, D_inf, α, D_imm]. The reporting rate ρ is not among them, because it belongs to the observation process rather than to the dynamics.
function seitl_ode!(du, u, p, t)
    R_0, D_lat, D_inf, α, D_imm = p

    β = R_0 / D_inf
    ϵ = 1.0 / D_lat
    ν = 1.0 / D_inf
    τ = 1.0 / D_imm

    S, E, I, T, L, Inc = u
    N = S + E + I + T + L

    du[1] = -β * S * I / N + (1 - α) * τ * T  # dS/dt
    du[2] = β * S * I / N - ϵ * E              # dE/dt
    du[3] = ϵ * E - ν * I                      # dI/dt
    du[4] = ν * I - τ * T                      # dT/dt
    du[5] = α * τ * T                          # dL/dt
    du[6] = ϵ * E                              # dInc/dt (cumulative)
end

function simulate_seitl_deterministic(θ, init_state, times)
    params = [θ[:R_0], θ[:D_lat], θ[:D_inf], θ[:α], θ[:D_imm]]

    u0 = [
        init_state[:S],
        init_state[:E],
        init_state[:I],
        init_state[:T],
        init_state[:L],
        0.0,
    ]

    prob = remake(SEITL_BASE_PROBLEM; u0 = u0, p = params, tspan = (times[1], times[end]))
    sol = solve(prob, Tsit5(), saveat = times)

    state_names = [:S, :E, :I, :T, :L, :Inc_cumulative]
    sol_matrix = reduce(hcat, sol.u)'
    df = DataFrame(sol_matrix, state_names)
    df[!, :time] = sol.t

    # Convert cumulative to daily incidence
    df[!, :Inc] = [0.0; diff(df.Inc_cumulative)]

    return df
end
The Turing model wrapping them belongs to this session:
"""
Turing model for SEITL - enables both simulation and inference.
When unconditioned, use for prior predictive simulation.
When conditioned with | (; obs = data), use for inference (in later sessions).
Pass `simulate` to choose how the trajectory is produced.
"""
@model function seitl_model(
    times, init_state, n_obs; simulate = simulate_seitl_deterministic
)
    # `times` starts one day before the first observation, so `traj.Inc[i + 1]`
    # is the incidence over the day the i-th observation counts
    @assert length(times) == n_obs + 1 "times must have one more point than there are observations"

    # Weakly informative priors
    R_0 ~ truncated(Normal(3.0, 2.0), lower=1.0)
    D_lat ~ truncated(Normal(2.0, 1.0), lower=0.5)
    D_inf ~ truncated(Normal(3.0, 2.0), lower=0.5)
    α ~ Beta(2, 2)
    D_imm ~ truncated(Normal(15.0, 10.0), lower=1.0)
    ρ ~ Beta(2, 2)

    # Create parameter dictionary
    θ = Dict(:R_0 => R_0, :D_lat => D_lat, :D_inf => D_inf,
             :α => α, :D_imm => D_imm, :ρ => ρ)

    # Simulate trajectory
    traj = simulate(θ, init_state, times)

    # Likelihood
    lambdas = [max(ρ * traj.Inc[i + 1], 1e-10) for i in 1:n_obs]
    obs ~ arraydist(Poisson.(lambdas))

    return traj
endMain.Notebook.seitl_modelThe simulator arrives as a keyword argument. The priors, the parameter dictionary and the Poisson observation process do not depend on how the trajectory is produced, so the simulation method and the compartment durations are orthogonal in the code as well as in the prose.
Now let’s try some parameter values based on the literature:
# First guess based on the literature
θ_guess = Dict(
    :R_0 => 2.0,
    :D_lat => 2.0,
    :D_inf => 2.0,
    :α => 0.9,
    :D_imm => 13.0,
    :ρ => 0.85
)

# Initial state
## The island as the ship lands, at the start of day 1. Of the five islanders it
## brought back, three had fallen ill during the eight day voyage and are past
## their infectious period, so they start in T; the two who developed symptoms on
## landing start in I. The rest of the 284 islanders are susceptible
init_state_guess = Dict(
    :S => 279.0,
    :E => 0.0,
    :I => 2.0,
    :T => 3.0,
    :L => 0.0
)

# Simulate
times = collect(0.0:1.0:59.0)
traj = simulate_seitl_deterministic(θ_guess, init_state_guess, times)

# Show first few rows
first(traj, 10)
10×8 DataFrame
| Row | S | E | I | T | L | Inc_cumulative | time | Inc |
|---|---|---|---|---|---|---|---|---|
| Float64 | Float64 | Float64 | Float64 | Float64 | Float64 | Float64 | Float64 | |
| 1 | 279.0 | 0.0 | 2.0 | 3.0 | 0.0 | 0.0 | 0.0 | 0.0 |
| 2 | 277.371 | 1.28743 | 1.5227 | 3.58952 | 0.229687 | 0.367424 | 1.0 | 0.367424 |
| 3 | 275.913 | 1.95318 | 1.58086 | 4.0588 | 0.494462 | 1.18907 | 2.0 | 0.821645 |
| 4 | 274.299 | 2.48875 | 1.84215 | 4.57734 | 0.792878 | 2.30047 | 3.0 | 1.1114 |
| 5 | 272.392 | 3.05101 | 2.21425 | 5.21188 | 1.13094 | 3.68273 | 4.0 | 1.38226 |
| 6 | 270.106 | 3.69713 | 2.67787 | 6.00095 | 1.51809 | 5.36559 | 5.0 | 1.68286 |
| 7 | 267.365 | 4.45454 | 3.23635 | 6.97749 | 1.96617 | 7.39847 | 6.0 | 2.03288 |
| 8 | 264.094 | 5.34131 | 3.90008 | 8.1757 | 2.48932 | 9.84169 | 7.0 | 2.44322 |
| 9 | 260.211 | 6.37068 | 4.6816 | 9.63282 | 3.10416 | 12.7635 | 8.0 | 2.9218 |
| 10 | 255.636 | 7.55179 | 5.59272 | 11.3893 | 3.83 | 16.2376 | 9.0 | 3.47413 |
The data are reported cases, and the model treats a case as reported with probability . The quantity to put beside the points is therefore , the number of cases the observation process expects to see, rather than the incidence itself. That is a derived quantity, computed from a trajectory after the fact, so it gets a name of its own.
expected_observations(traj, ρ) = ρ .* traj.Incexpected_observations (generic function with 1 method)Plotting code
# Plot the expected reported cases against the data
p = plot(title = "SEITL Model: Deterministic Simulation",
         xlabel = "Time (days)", ylabel = "Reported cases")

# Thin the simulated incidence by the reporting rate
plot!(p, traj.time, expected_observations(traj, θ_guess[:ρ]),
      label = "Expected reported cases", linewidth = 2, color = :blue)

# Overlay real data
scatter!(p, flu_tdc.time, flu_tdc.obs,
         label = "Observed data", markersize = 4, color = :red)

plot!(p)
You can visualise all state variables by plotting them:
Plotting code
# Plot all state variables
plot(
    plot(traj.time, traj.S, label = "S", title = "Susceptible", ylabel = "Count"),
    plot(traj.time, traj.E, label = "E", title = "Exposed", ylabel = "Count"),
    plot(traj.time, traj.I, label = "I", title = "Infectious", ylabel = "Count"),
    plot(traj.time, traj.T, label = "T", title = "Temporary immunity", ylabel = "Count"),
    plot(traj.time, traj.L, label = "L", title = "Long-term immunity", ylabel = "Count"),
    plot(traj.time, traj.Inc, label = "Inc", title = "Daily incidence", ylabel = "Count"),
    layout = (3, 2), size = (800, 600), legend = false
)
Note that although the simulation of the trajectory is deterministic, the observation process is stochastic (Poisson with reporting rate ). The curve above is the mean of that process, and the replicates below are draws from it. You can generate multiple observation replicates, using generate_observations, which comes from the package too:
function generate_observations(trajectory, ρ)
    return [rand(Poisson(max(ρ * inc, 1e-10))) for inc in trajectory.Inc]
end
# Generate 100 replicates of observations
p = plot(title = "Observation Process Variability",
xlabel = "Time (days)", ylabel = "Reported cases")
for i in 1:100
obs = generate_observations(traj, θ_guess[:ρ])
plot!(p, traj.time, obs, alpha = 0.2, color = :lightblue, label = "")
end
# Overlay real data
scatter!(p, flu_tdc.time, flu_tdc.obs,
label = "Observed data", markersize = 4, color = :red)
plot!(p)
Using Turing for simulation
You’ve just seen how to simulate the model by directly calling the simulation function with specific parameter values. However, since we’ve defined a Turing @model, we can also sample from the prior predictive distribution. This is useful when we want to explore the range of behaviours the model can produce before seeing any data. sample(model, Prior(), n) draws parameter values from the priors. The model is not conditioned on data here, so obs is drawn alongside them and every sample carries a full set of reported counts. Those counts are the prior predictive distribution. They carry the spread of the parameters, the reporting rate and the Poisson noise together, which is what the model claims about the data and therefore what belongs beside the points.
prior_model = seitl_model(times, init_state_guess, length(times) - 1)
prior_draws = sample(prior_model, Prior(), 5, progress=false)

p = plot(title = "Prior Predictive Simulations",
         xlabel = "Time (days)", ylabel = "Reported cases")

# `prior_draws[@varname(obs)][i, 1]` is the whole count vector for the i-th draw
for i in 1:5
    plot!(p, flu_tdc.time, prior_draws[@varname(obs)][i, 1],
          linewidth = 1.5, alpha = 0.8, label = "")
end

scatter!(p, flu_tdc.time, flu_tdc.obs,
         label = "Observed data", markersize = 4, color = :red)

plot!(p)
Every draw is a plausible outbreak, rising over the first week or two to a peak of between 10 and 25 reported cases before a long and noisy decline. That is what you want to see from a prior predictive draw, and it is the reason for looking before you fit.
Notice how the same @model definition can be used for both simulation (here) and inference (in the Particle MCMC session).
Latent quantities
The figure above shows what the priors imply for the observations, because those are what we will hold against data. The same draws also give the latent incidence: the infections the model says happened, whether or not anyone wrote them down. returned collects the trajectory the model simulated for each draw, so both quantities come out of one push-forward and expected_observations turns one into the other. The reporting rate drawn from the prior determines how much the latent incidence differs from the observations.
prior_trajs = vec(returned(prior_model, prior_draws))
prior_ρ = vec(prior_draws[@varname(ρ)])
5-element Vector{Float64}:
0.5801734373636477
0.5010106281488629
0.3754639722199895
0.5026205872943478
0.5146130579041324Plotting code
p = plot(title = "Latent incidence and expected reports",
         xlabel = "Time (days)", ylabel = "Cases per day")

# One colour per prior draw. The shading runs from the latent curve down to its
# expected reports, so it is the part of the epidemic that goes unrecorded
for (i, (traj, ρ)) in enumerate(zip(prior_trajs, prior_ρ))
    plot!(p, traj.time, traj.Inc,
          fillrange = expected_observations(traj, ρ), fillalpha = 0.18,
          color = i, linestyle = :solid, linewidth = 1.5, label = "")
    plot!(p, traj.time, expected_observations(traj, ρ),
          color = i, linestyle = :dash, linewidth = 1.5, label = "")
end

# Grey entries name the two styles, since the colours only identify the draw
plot!(p, Float64[], Float64[], color = :grey, linestyle = :solid,
      linewidth = 1.5, label = "Latent incidence")
plot!(p, Float64[], Float64[], color = :grey, linestyle = :dash,
      linewidth = 1.5, label = "Expected reported cases")

scatter!(p, flu_tdc.time, flu_tdc.obs,
         label = "Observed data", markersize = 4, color = :red)
WarningWhat the latent scale cannot tell you
Nothing observes latent incidence, so no part of the data can confirm or contradict the solid lines. Only the dashed ones are held against the points. The distance between a pair is a claim the model makes about how much went unrecorded, and until the model is fitted that claim comes entirely from the prior on .
Now, take 5 minutes to explore the dynamics of the model for different parameter and initial state values. In particular, try different values for and . For which values of and do you get a decent fit?
You should find that it is hard to capture all the data-points with the deterministic model. We will now test if this can be better reproduced with a stochastic model which explicitly accounts for the discrete nature of individuals.
Stochastic simulations
The stochastic simulation uses the Gillespie algorithm, which simulates individual events (infections, recoveries) as random occurrences. Unlike ODEs which give smooth trajectories, this captures the inherent randomness in small populations. Each event is sampled from the possible transitions weighted by their rates, and waiting times between events follow exponential distributions.
The model has the following transitions:
| Transition | Rate | Effect |
|---|---|---|
| S → E | S-1, E+1 | |
| E → I | E-1, I+1 (count as new case) | |
| I → T | I-1, T+1 | |
| T → S | T-1, S+1 | |
| T → L | T-1, L+1 |
NoteImplementation: the transitions
simulate_seitl_stochastic walks through the days and hands each one to seitl_jump_step!, which advances the state over that day and returns the cases it produced. JumpProcesses.jl samples the transitions in the table above, written here as reactants and the changes they cause. The number of temporary immunity stages is read from the state, so the same description gives SEIT4L later in the session.
function seitl_stoichiometry(k::Integer)
    S, E, I, L, Inc = 1, 2, 3, k + 4, k + 5
    T(j) = 3 + j  ## T_1 ... T_k sit between I and L

    reactants = [[S => 1, I => 1], [E => 1], [I => 1]]
    net = [[S => -1, E => 1], [E => -1, I => 1, Inc => 1], [I => -1, T(1) => 1]]

    for j in 1:(k - 1)  ## progress through the stages of temporary immunity
        push!(reactants, [T(j) => 1])
        push!(net, [T(j) => -1, T(j + 1) => 1])
    end

    push!(reactants, [T(k) => 1])  ## immunity wanes
    push!(net, [T(k) => -1, S => 1])

    push!(reactants, [T(k) => 1])  ## immunity becomes long term
    push!(net, [T(k) => -1, L => 1])

    return reactants, net
end

function seitl_rate_constants(θ::Dict, N::Real, k::Integer)
    β = θ[:R_0] / θ[:D_inf]
    ϵ = 1.0 / θ[:D_lat]
    ν = 1.0 / θ[:D_inf]
    τ = k / θ[:D_imm]
    α = θ[:α]

    rates = Vector{Float64}(undef, k + 4)
    rates[1], rates[2], rates[3] = β / N, ϵ, ν
    for j in 1:(k - 1)
        rates[3 + j] = τ
    end
    rates[k + 3] = (1 - α) * τ
    rates[k + 4] = α * τ
    return rates
end
TipCode explainer
- Reactants and net change: each transition says which compartments it consumes and how the state changes, so
[S => 1, I => 1]with[S => -1, E => 1]is an infection - Rate constants: mass action, so the rate of a transition is its constant times the reactants present. The infection rate becomes the constant times times , which every transition conserving makes exact
T(j): the temporary immunity stages are built in a loop overk, which is why one description serves SEITL and SEIT4LInc: a slot in the state that no rate reads, incremented by the E → I transition, so daily incidence is read off like a compartmentrng:seitl_jump_problemtakes a generator, so you can reproduce a trajectory by passingrng = MersenneTwister(seed)
NoteComing from R?
In R, the GillespieSSA2 and adaptivetau packages provide Gillespie simulation. The odin and dust packages from the MRC Centre offer a more performant framework for stochastic compartmental models. Here the algorithm is run by Julia’s JumpProcesses.jl, which samples the same transitions exactly, and the transitions themselves are shown above so the algorithm stays visible.
The Turing model does not change. Demographic stochasticity enters through the simulator alone, so the stochastic version is seitl_model(times, init_state, n_obs; simulate = simulate_seitl_stochastic).
Now let’s run stochastic simulations with the same parameters:
# Run a single stochastic simulation
traj_stoch = simulate_seitl_stochastic(θ_guess, init_state_guess, times)

# Plot
p = plot(title = "SEITL Model: Stochastic Simulation",
         xlabel = "Time (days)", ylabel = "Reported cases")

plot!(p, traj_stoch.time, expected_observations(traj_stoch, θ_guess[:ρ]),
      label = "Expected reported cases", linewidth = 2, color = :blue)

scatter!(p, flu_tdc.time, flu_tdc.obs,
         label = "Observed data", markersize = 4, color = :red)

plot!(p)
Run multiple stochastic replicates to see variability:
# Generate multiple stochastic trajectories with the same parameters
# This shows the variability from demographic stochasticity
p = plot(title = "SEITL Model: 50 Stochastic Replicates",
         xlabel = "Time (days)", ylabel = "Reported cases")

for i in 1:50
    traj_rep = simulate_seitl_stochastic(θ_guess, init_state_guess, times)
    plot!(p, traj_rep.time, expected_observations(traj_rep, θ_guess[:ρ]),
          alpha = 0.3, color = :lightblue, label = "")
end

scatter!(p, flu_tdc.time, flu_tdc.obs,
         label = "Observed data", markersize = 4, color = :red)

plot!(p)
Each replicate is the mean of the observation process for one stochastic trajectory, so the band you see is demographic stochasticity alone. Adding a Poisson draw on top of each one would widen it further, and the observation process figure above shows by how much.
Note
Just like with the deterministic model, you can use the Turing @model for prior predictive checks by sampling parameters from priors, without conditioning on data. Condition with | (; obs = data) when fitting, and leave the model unconditioned when simulating. The Particle filters and Particle MCMC sessions still use Turing, with the same @model macro and the same ~ statements for the priors. Only the line for the observations changes. A deterministic simulator gives one incidence curve per parameter set, so the data can be given a distribution directly, as obs ~ arraydist(Poisson.(lambdas)) above. A stochastic simulator gives a different curve every run, so there is no single curve to put inside Poisson, and those sessions estimate the likelihood with a particle filter and add it to the model with @addlogprob!. See the unified approach section at the end of this session for the full pattern.
TipExercise: Explore stochastic SEITL dynamics
What differences do you notice between stochastic and deterministic simulations? Can you make any conclusions on the role of demographic stochasticity on the dynamics of the SEITL model?
TipWhat to look for
Three differences show up reliably. Individual stochastic runs are jagged where the deterministic one is smooth, because transitions happen as discrete events rather than continuous flows. Their peaks land at different times, sometimes days apart, since early chance events shift the whole trajectory. And some runs fade out entirely while others take off, which the deterministic model cannot do at all.
The conclusion worth drawing is that the deterministic trajectory is not the “average” stochastic one. Averaging over runs that peak at different times gives a curve that is lower and broader than any individual run, so the deterministic solution sits somewhere among the possibilities rather than at their centre.
This matters most in a population this size. Tristan da Cunha had 284 people, and demographic noise scales roughly as , so chance is a first-order effect rather than a correction. It is the reason the rest of the course needs machinery that can handle a stochastic model rather than fitting the deterministic one and hoping.
Now we make this model a bit more realistic.
Exponential vs Erlang distributions
So far, we have assumed that the time spent in each compartment follows an exponential distribution, because by assuming transitions happen at constant rates we have implied that the process is memoryless. Although mathematically convenient, this property is not realistic for many biological processes such as the contraction of the cellular response.
In order to include a memory effect, it is common practice to replace the exponential distribution by an Erlang distribution. This distribution is parametrised by its mean and shape and can be modelled by consecutive sub-stages, each being exponentially distributed with mean .
As illustrated below the flexibility of the Erlang distribution ranges from the exponential () to Gaussian-like () distributions.

We propose to extend the SEITL by replacing the single T compartment with 4 sub-stages (k=4). Why 4? This is a pragmatic choice from the original Camacho et al. (2011) paper: k=4 gives a bell-shaped distribution that is more realistic than the exponential (k=1), while keeping the model small enough to fit efficiently. The “Going further” section at the end invites you to explore other values of k.
The extended model looks as follows:

SEIT4L model implementation
These two live in src/seitl_model.jl beside the SEITL pair, and arrived with using MFIIDD in the same way. They are shown from that source for the same reason.
function seit4l_ode!(du, u, p, t)
    R_0, D_lat, D_inf, α, D_imm = p

    β = R_0 / D_inf
    ϵ = 1.0 / D_lat
    ν = 1.0 / D_inf
    τ = 4.0 / D_imm  # Rate through each T sub-stage

    S, E, I, T1, T2, T3, T4, L, Inc = u
    N = S + E + I + T1 + T2 + T3 + T4 + L

    du[1] = -β * S * I / N + (1 - α) * τ * T4  # dS/dt
    du[2] = β * S * I / N - ϵ * E              # dE/dt
    du[3] = ϵ * E - ν * I                      # dI/dt
    du[4] = ν * I - τ * T1                     # dT1/dt
    du[5] = τ * T1 - τ * T2                    # dT2/dt
    du[6] = τ * T2 - τ * T3                    # dT3/dt
    du[7] = τ * T3 - τ * T4                    # dT4/dt
    du[8] = α * τ * T4                         # dL/dt
    du[9] = ϵ * E                              # dInc/dt (cumulative)
end

function simulate_seit4l_deterministic(θ, init_state, times)
    params = [θ[:R_0], θ[:D_lat], θ[:D_inf], θ[:α], θ[:D_imm]]

    u0 = [
        init_state[:S],
        init_state[:E],
        init_state[:I],
        init_state[:T1],
        init_state[:T2],
        init_state[:T3],
        init_state[:T4],
        init_state[:L],
        0.0,
    ]

    prob = remake(SEIT4L_BASE_PROBLEM; u0 = u0, p = params, tspan = (times[1], times[end]))
    sol = solve(prob, Tsit5(), saveat = times)

    state_names = [:S, :E, :I, :T1, :T2, :T3, :T4, :L, :Inc_cumulative]
    sol_matrix = reduce(hcat, sol.u)'
    df = DataFrame(sol_matrix, state_names)
    df[!, :time] = sol.t

    df[!, :Inc] = [0.0; diff(df.Inc_cumulative)]

    return df
end
The Turing model does not change here either. SEIT4L carries nine state variables where SEITL carries six, but the initial state is already an argument, so seitl_model(times, init_state_4l, n_obs; simulate = simulate_seit4l_deterministic) fits SEIT4L under the same priors and the same observation process. init_state_4l is built below.
TipExercise: Understand the SEIT4L code
How does the code above implement the Erlang distribution for the compartment? What changes from the SEITL version?
TipSolution
The single compartment is replaced by four in series, to , each leaving at four times the rate. Time spent passing through all four is the sum of four exponential waiting times, which is by definition Erlang-distributed with shape 4, while the mean total duration is unchanged.
Everything else follows from that: four state variables instead of one, four transitions instead of one, and the stoichiometry matrix gains the corresponding rows and columns.
The point is the shape of the waiting-time distribution rather than its mean. A single exponential compartment says the most likely thing is to leave immediately, which is a strange claim about temporary immunity. Chaining four gives a distribution with a peak away from zero, so most individuals stay immune for something close to the average duration. This is the standard trick for putting a realistic waiting time into a compartmental model, and the number of compartments controls how realistic the waiting time is.
Now compare the dynamics of the SEITL and SEIT4L models. Use your best guess from the previous section for the parameters. Note that although SEITL and SEIT4L share the same parameters, their state variables differ so you need to modify the initial state of SEIT4L accordingly.
# Initial state for SEIT4L (need to split T into 4 stages)
init_state_4l = Dict(
    :S => 279.0,
    :E => 0.0,
    :I => 2.0,
    :T1 => 3.0,
    :T2 => 0.0,
    :T3 => 0.0,
    :T4 => 0.0,
    :L => 0.0
)

# Try with better parameter values that produce two waves
θ_better = Dict(
    :R_0 => 10.0,
    :D_lat => 2.0,
    :D_inf => 2.0,
    :α => 0.5,
    :D_imm => 13.0,
    :ρ => 0.7
)

# Simulate both models
traj_seitl = simulate_seitl_deterministic(θ_better, init_state_guess, times)
traj_seit4l = simulate_seit4l_deterministic(θ_better, init_state_4l, times)

# Plot comparison
p = plot(title = "SEITL vs SEIT4L", xlabel = "Time (days)",
         ylabel = "Reported cases")

plot!(p, traj_seitl.time, expected_observations(traj_seitl, θ_better[:ρ]),
      label = "SEITL (exponential T)", linewidth = 2, color = :blue)
plot!(p, traj_seit4l.time, expected_observations(traj_seit4l, θ_better[:ρ]),
      label = "SEIT4L (Erlang-4 T)", linewidth = 2, color = :green)

scatter!(p, flu_tdc.time, flu_tdc.obs,
         label = "Observed data", markersize = 4, color = :red)

plot!(p)
Both curves are thinned by the same , so they can be read against each other and against the points.
Can you notice any differences? If so, which model seems to provide the best fit? Do you understand why the shape of the epidemic changes when you use the Erlang distribution for the compartment?
NoteModel comparison: a preview
We now have multiple mechanistic models that could explain the two-wave pattern:
- SEITL: Exponential duration in T compartment (memoryless)
- SEIT4L: Erlang-4 duration in T compartment (more realistic timing)
Both encode the same biological hypothesis (temporary immunity followed by potential reinfection), but make different assumptions about the distribution of time spent in temporary immunity. The original Camacho et al. (2011) paper compared these and other variants using information criteria (DIC) and found that SEIT4L provided a better fit.
In the Particle filters and Particle MCMC sessions, we’ll fit both models to data and compare them.
From simulation to inference: the unified Turing approach
Note
Throughout this session, you’ve defined models using the @model macro with the pattern:
@model function my_model(times, init_state, n_obs)
    # 1. Define priors
    R_0 ~ truncated(Normal(3.0, 2.0), lower=1.0)
    # ... other parameters

    # 2. Simulate trajectory
    traj = simulate(θ, init_state, times)

    # 3. Likelihood
    obs ~ arraydist(Poisson.(λ))

    return traj
end
The obs variable is not a function argument — it is a random variable defined by the ~ statements. To supply observed data, use the | (condition) operator:
# `times` must start one day before the first observation, so that the trajectory
# has an incidence for every observed day: `length(times) == length(data) + 1`
model = my_model(times, init_state, length(data)) | (; obs = data)
That extra leading time point lets the model compare each observation with the incidence over the day it counts, rather than with the day before it.
This unified structure enables both:
- Simulation (this session): Call
sample(my_model(times, init_state, n_obs), Prior(), n)to draw from the prior predictive distribution (no conditioning —obsis sampled) - Inference (next session): Call
sample(model, NUTS(), 1000)wheremodelis conditioned on data (the exact sampler choice depends on the model — see the MCMC and Particle MCMC sessions) - Posterior prediction: Use
predict(decondition(model), chain)to generate new observations from the fitted model
You write the model once and use it for all purposes. This is the power of probabilistic programming!
Learning points
TipLearning points
- Deterministic models are fast but ignore individual-level randomness
- Stochastic models capture demographic stochasticity, important for small populations
- Erlang distributions provide more realistic compartment durations than exponential
- Same parameters, different dynamics: stochastic models show variability even with fixed parameters
- Unified Turing models work for both simulation and inference
ImportantWhy we need particle filters
Fitting stochastic models is fundamentally harder than fitting deterministic ones. With a deterministic model, the same parameters always produce the same trajectory, so the likelihood is straightforward. With a stochastic model, the same parameters can produce wildly different trajectories — there is no single “expected” output to compare against.
Particle filters solve this by running many stochastic simulations simultaneously and estimating the likelihood as an average. The next session introduces this technique.
References
- Camacho et al. (2011). Explaining rapid reinfections in multiple-wave influenza outbreaks: Tristan da Cunha 1971 epidemic as a case study. Proc. R. Soc. B 278(1725), 3635-3643. (The original SEITL model paper - highly recommended!)
- Mantle & Tyrrell (1973). An epidemic of influenza on Tristan da Cunha. Journal of Hygiene 71(1), 89-95. (Original outbreak data)
- JumpProcesses.jl - Stochastic simulation in Julia (Gillespie algorithm and more)
- Turing.jl documentation - Probabilistic programming in Julia
Going further
- Curious about why we use the Poisson likelihood for count data? Have a look at the bottom of page 3 of this reference from Germán Rodríguez’ lecture notes on generalized linear models.
- Stochastic SEIT4L: We implemented a stochastic version of SEITL but not SEIT4L. As an exercise, try implementing
simulate_seit4l_stochasticby extending the Gillespie algorithm with additional transitions for the T1→T2→T3→T4 sub-stages. The stoichiometry matrix will need 7 transitions instead of 5. - You might wonder why we only modified the distribution of the compartment. Indeed, wouldn’t it be more realistic to use Erlang distributions for all the other compartments? And why did we use a shape equal to 4 and not 2 or 100? Think about another variant of the SEITL model and implement it by modifying the original version in a similar way as we did for the SEIT4L model. Does it fit the data better?